LOOKER STUDIO DASHBOARDS
Multi-Organisation
Performance
Reporting System
This project was delivered in collaboration with Amplify SA and involved the design and implementation of digital performance dashboards for four media organisations: Crown TV, Zambian Business Times, Kasama Radio,
and Byta FM.
Rather than creating a single reporting dashboard, the project required the development of dedicated reporting environments for each organisation. Each dashboard was designed to provide stakeholders with a comprehensive view of their digital performance across multiple platforms, including website analytics, search visibility, and social media engagement.
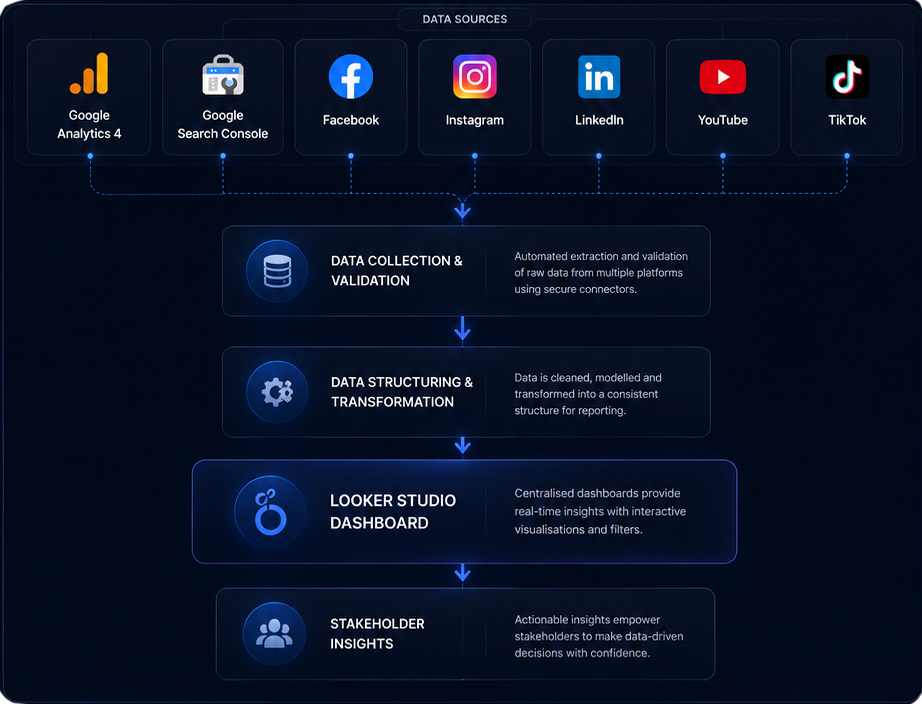
To achieve this, data from Google Analytics 4, Google Search Console, Facebook, Instagram, YouTube, TikTok, and other relevant sources was gathered, structured, and transformed into intuitive reporting experiences within Looker Studio.
4 Organisations
Multiple Data Sources
Centralised Information
Actionable Insights
Understanding the Reporting Challenge
Managing digital performance across multiple organisations presented a unique reporting challenge. Each organisation generated data across numerous platforms, including websites, search engines, and social media channels. While valuable insights existed within these systems, the information was often fragmented across different tools and reporting formats, making it difficult for stakeholders to gain a complete view of performance.
In addition to website analytics and search data, social media metrics required manual collection, validation, and structuring before meaningful reporting could take place. This created a time-consuming process and limited the ability to analyse performance consistently across channels.
The objective was to design and develop dedicated reporting environments for each organisation, bringing together key performance metrics from multiple sources into a single, easy-to-use dashboard experience. By consolidating fragmented datasets into clear and accessible reporting frameworks, stakeholders were able to monitor performance more efficiently, identify trends faster, and make more informed decisions based on reliable data.
Multiple Organisations
Four organisations with distinct reporting requirements.
Fragmented Data Sources
Performance data distributed across numerous platforms.
Manual Data Collection
Social media metrics gathering and validation.
Limited Visibility
Stakeholders needed a single source of truth for reporting.
Data Sources & Integration
One of the most significant challenges of the project was consolidating data from multiple platforms into a single reporting ecosystem.
Each organisation generated performance data across a variety of digital channels, including websites, search engines, and social media platforms. While these sources provided valuable insights individually, they lacked a unified structure that would allow stakeholders to view performance holistically.
To address this challenge, a reporting framework was established that combined website analytics, search visibility metrics, and social media performance into a centralised dashboard environment.
Dashboard Experience Design
Transforming complex datasets into meaningful insights required more than simply connecting data sources.
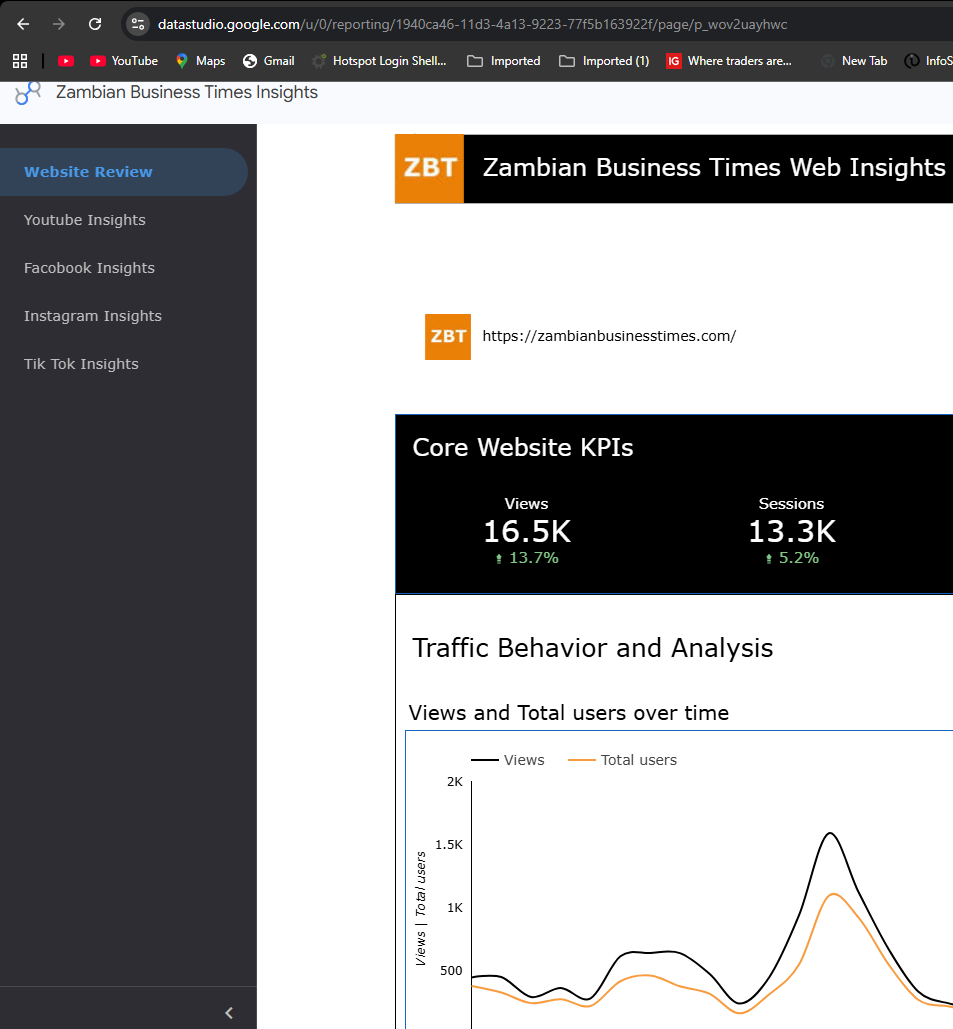
The reporting environment was designed to provide stakeholders with a clear and intuitive experience, allowing them to understand performance at a glance while maintaining access to more detailed information when required.
Special attention was given to information hierarchy, KPI visibility, visual consistency, and filtering capabilities to ensure users could navigate large volumes of data efficiently.
Reporting Framework & Performance Insights
The reporting framework was designed to provide stakeholders with both high-level performance visibility and detailed analytical insights.
Rather than relying on separate reporting tools for each platform, the dashboards consolidated key performance indicators into a single environment, enabling users to monitor website activity, search visibility, audience growth, and social media engagement from one central location.
This approach improved reporting efficiency while providing a more complete understanding of digital performance across multiple organisations.
Below is my
WORK
Dashboard Design
Designing clear and accessible reporting experiences.
Stakeholder Support
Helping stakeholders understand and utilise performance data effectively.
Project Outcome
Consolidated Information
The project resulted in a scalable reporting ecosystem capable of presenting key insights from multiple platforms through a unified reporting framework.
By combining analytics integration, structured data workflows, dashboard design, and information visualisation principles, the solution transformed fragmented performance data into accessible and actionable business intelligence.
The dashboards continue to provide stakeholders with a centralised view of digital performance, enabling more efficient reporting and better-informed decision-making.